Scan Data
Scan Data gives you a row-by-row record of every scan across your QR codes — including the QR name, type, timestamp, city, state, country, postcode, device, OS, and browser. You can filter by date range, customise which columns are shown, and export the full dataset as an Excel or CSV file.
What can I do in Scan Data?
- View scan records — see every individual scan with QR name, type, timestamp, and location
- Filter by QR code — narrow results to one or more specific QR codes
- Filter by date range — choose 7D, 30D, 90D, 1M, 6M, or 1Y
- Customise columns — show or hide fields like Device, OS, Latitude, and Longitude
- Export as Excel — download all scan records in Excel format
- Export as CSV — download all scan records as a CSV file
Step 1: Open Scan Data
Click Scan Data in the left sidebar under the Analytics section. The page loads a table of Scan Results showing every recorded scan. Each row includes:
- QR Name — the name of the QR code that was scanned
- QR Type — the type of QR code (e.g. VCARD, Website URL)
- Scanned On — the exact date and time of the scan
- City, State, Country, Postcode — the geographic location of the scanner
- Browser — the browser used to open the QR code landing page
Use the Filter applied dropdown at the top to filter by specific QR codes. Use the date range buttons (7D, 30D, 90D, 1M, 6M, 1Y) to limit results to a time period. Two export buttons sit in the top-right corner — Export Data Report (Excel) and Export CSV Report (CSV).
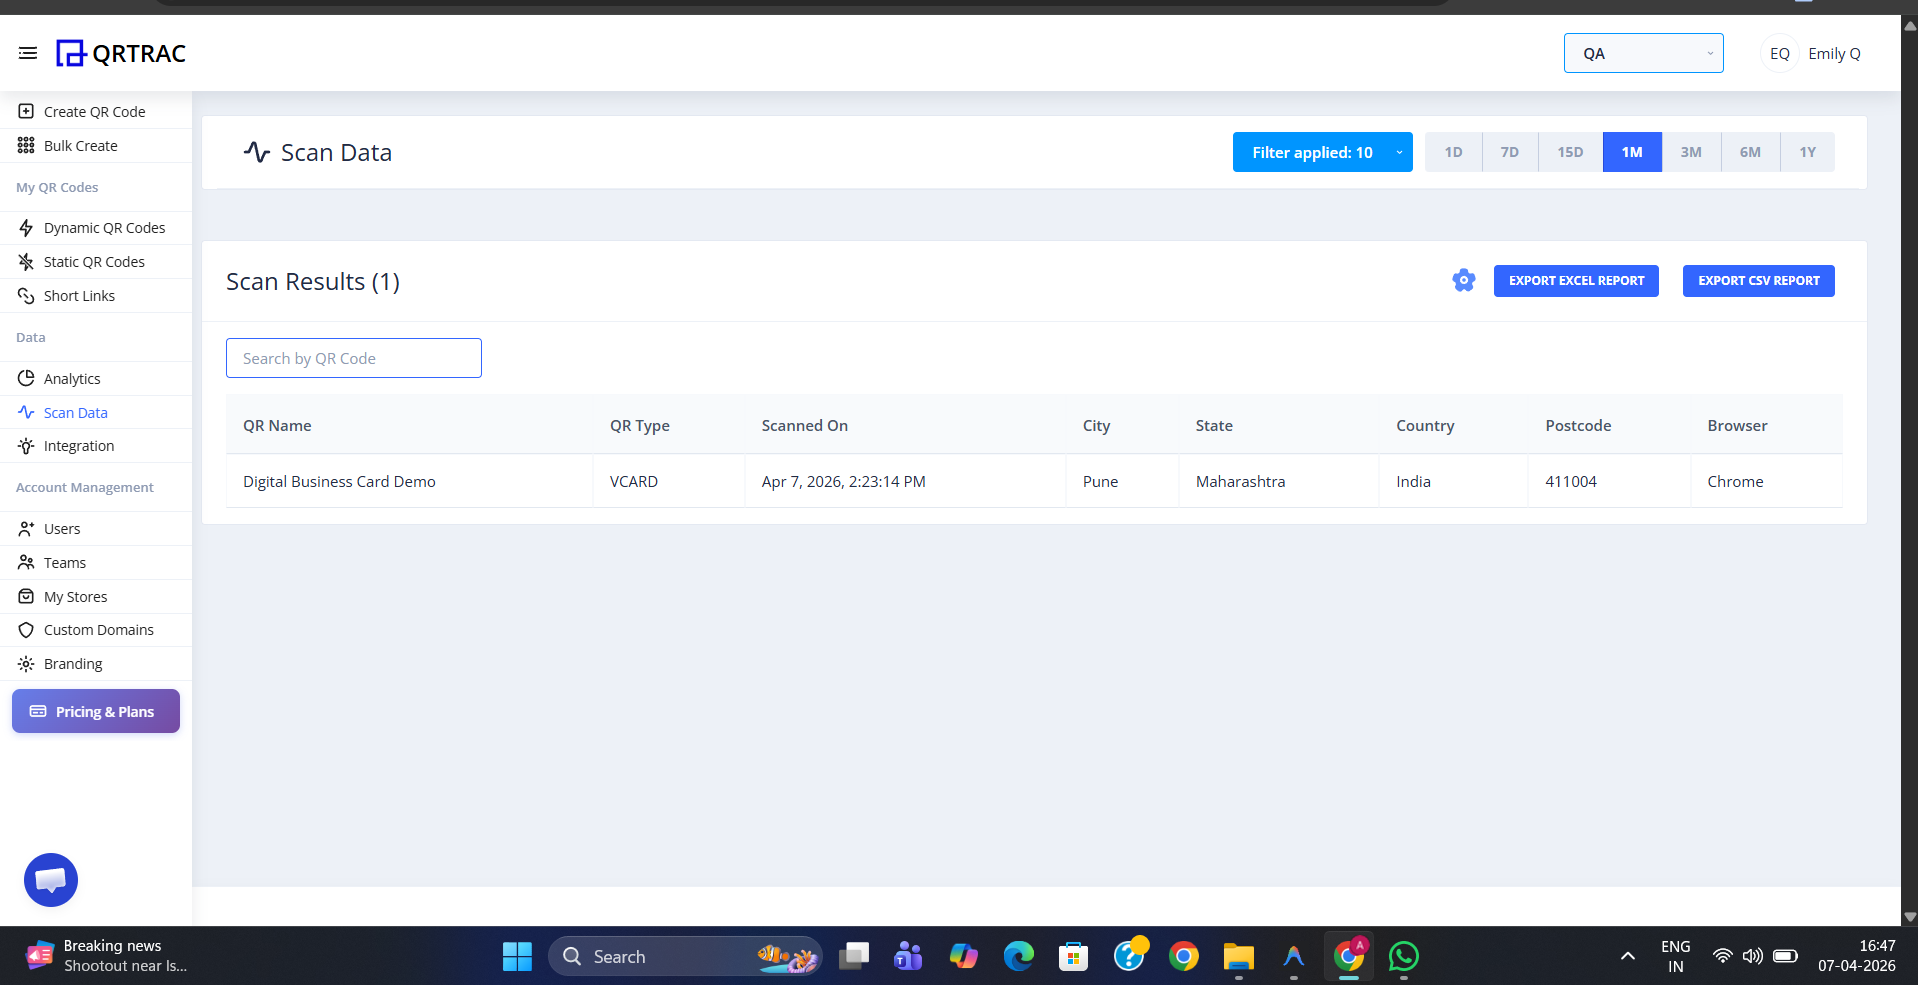
Scan Data table — every scan in one place, with date filters and two export options
Step 2: Customise Columns
Click the settings icon (gear icon) next to the Scan Results heading to open the Select Columns panel on the right. Check or uncheck any column to show or hide it in the table. Available columns include:
- QR Name, QR Type, Scanned On, Browser
- Device, OS
- Scanned City, State, Country
- Latitude, Longitude
Your column selection also determines which fields appear in the exported file. Select only the columns you need before downloading to keep your export clean and focused.
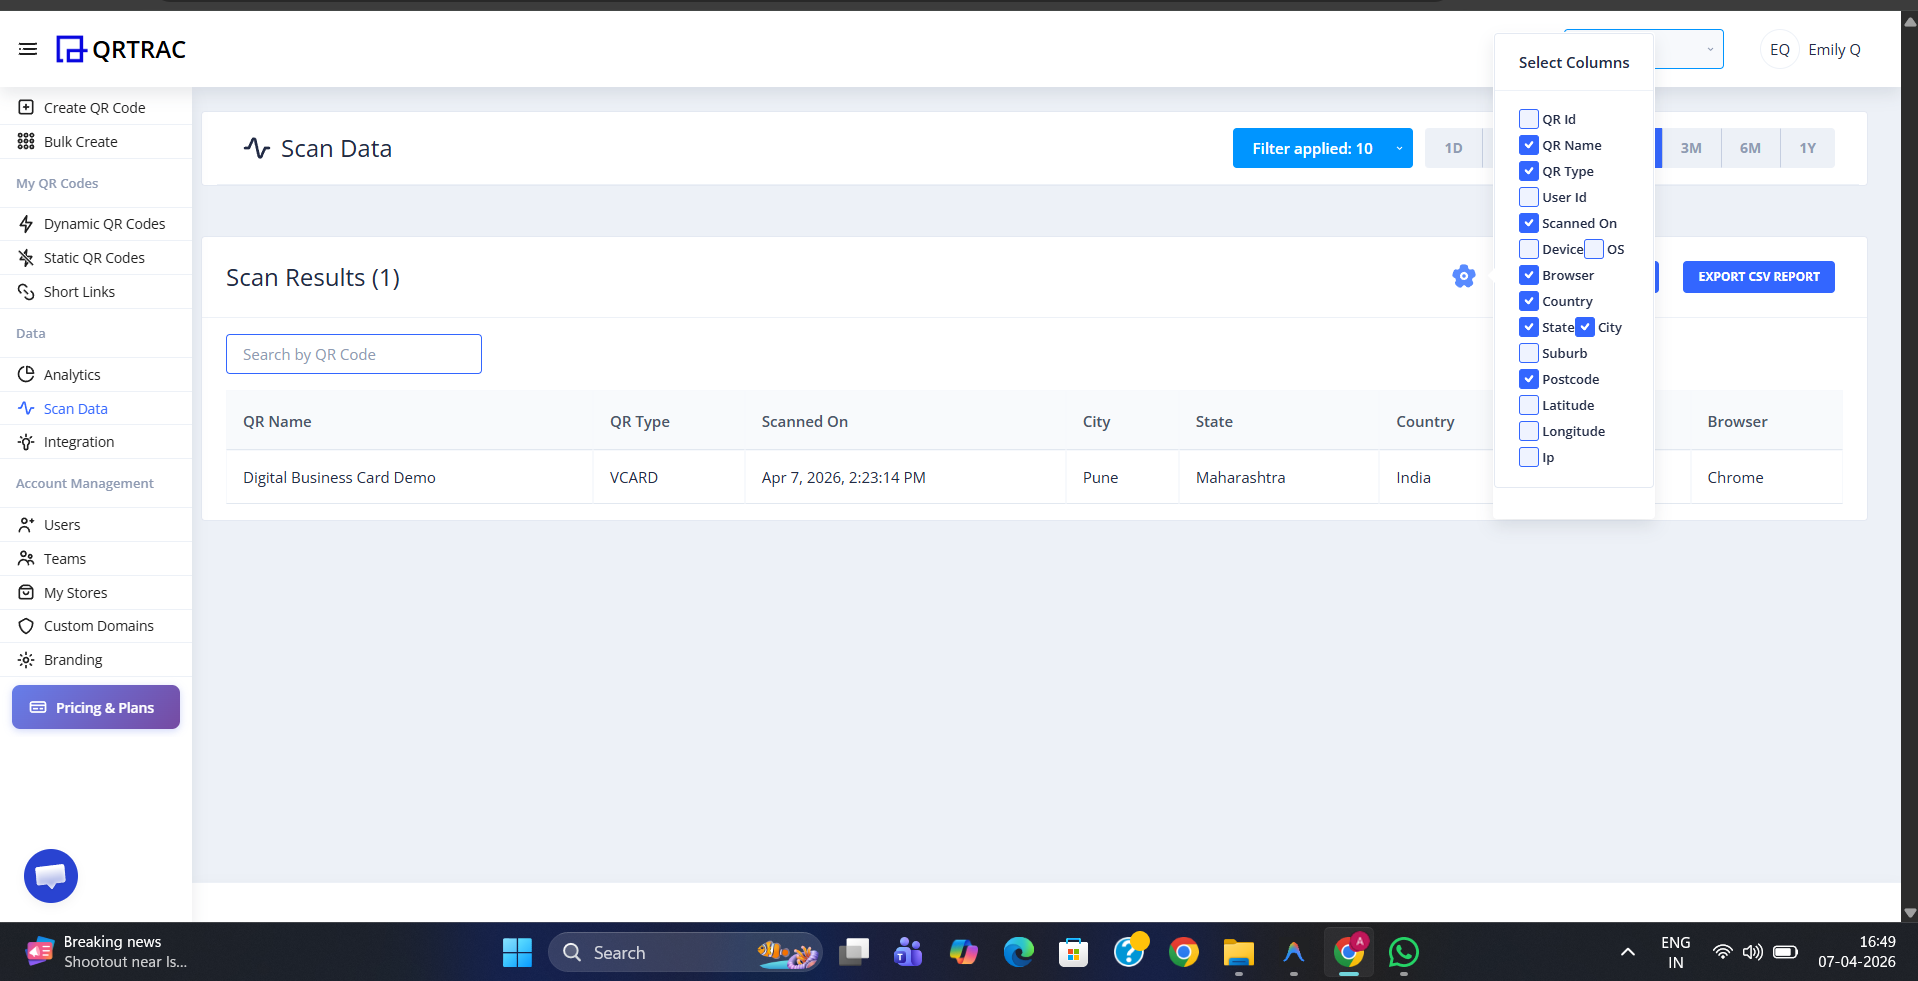
Click the settings icon to open Select Columns — choose exactly which fields to display and export
Tip: Enable Latitude and Longitude columns before exporting if you want to plot scan locations in your own mapping tool or BI software.
Step 3: Download Your Scan Data
Once you have filtered the results and selected your columns, download your data using either of the two export buttons:
- Export Data Report — downloads the scan data as an Excel (.xlsx) file, ready to open in Microsoft Excel or Google Sheets
- Export CSV Report — downloads the scan data as a CSV (.csv) file, compatible with any spreadsheet or data tool
The exported file includes all visible columns for every scan in the currently filtered date range. The Excel output includes columns for QR Id, QR Name, QR Type, User Id, Scanned On, Device, OS, Browser, Country, State, City, Suburb, Postcode, Latitude, and Longitude.
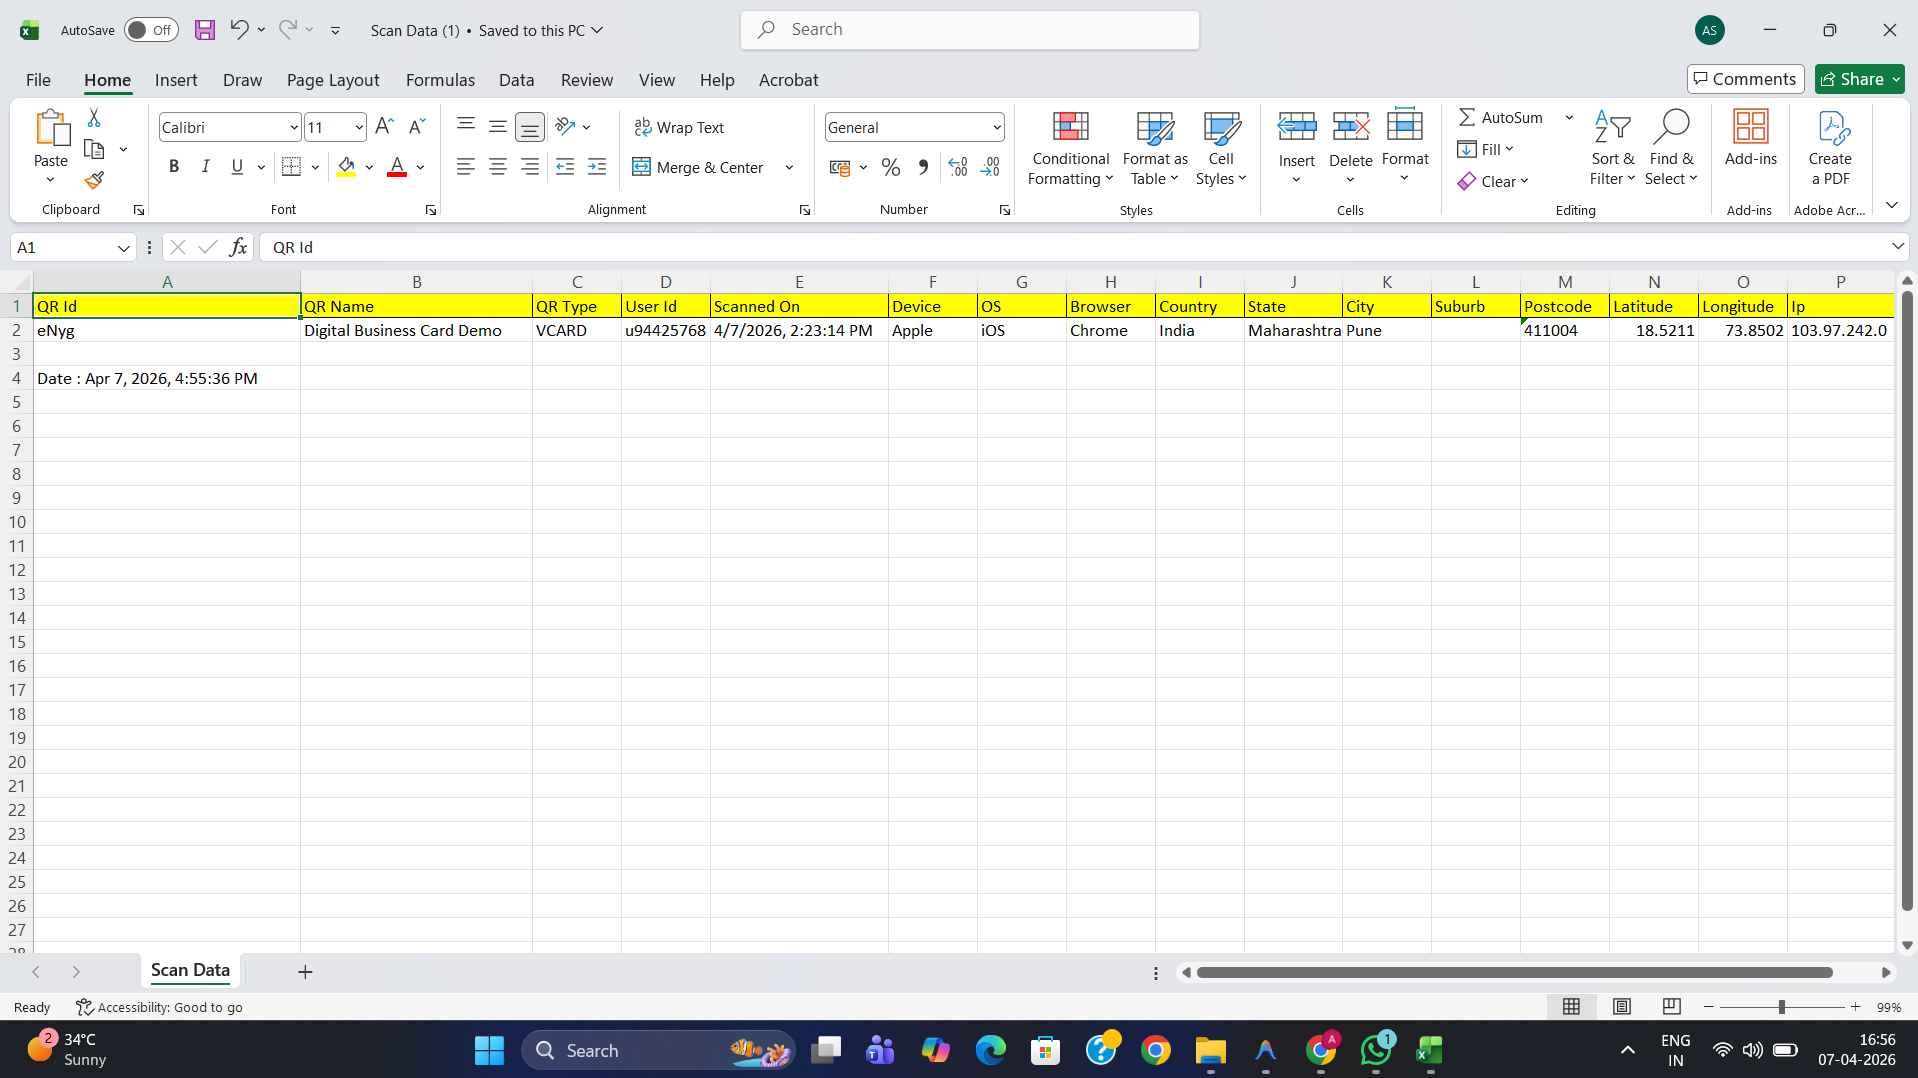
The Excel export includes every scan detail — ready for analysis in Excel, Google Sheets, or any BI tool
Only Dynamic QR codes generate scan records
Static QR codes do not pass through QRTRAC's servers, so no scan data is recorded for them. Scan Data only shows records from Dynamic QR codes.